Client Requirements
The customer is a renowned Telehealth company in the United States that allows patients to connect with healthcare professionals virtually at any time and from any location. They sought to produce analytical reports for their clients that would display pertinent information regarding patient data, including the most prevalent diagnoses and treatments. These reports would highlight trends related to patient participation in various programs, the number of interactions, the amount of time dedicated to each patient, and the revenue generated by different programs.
Thinkitive Solution
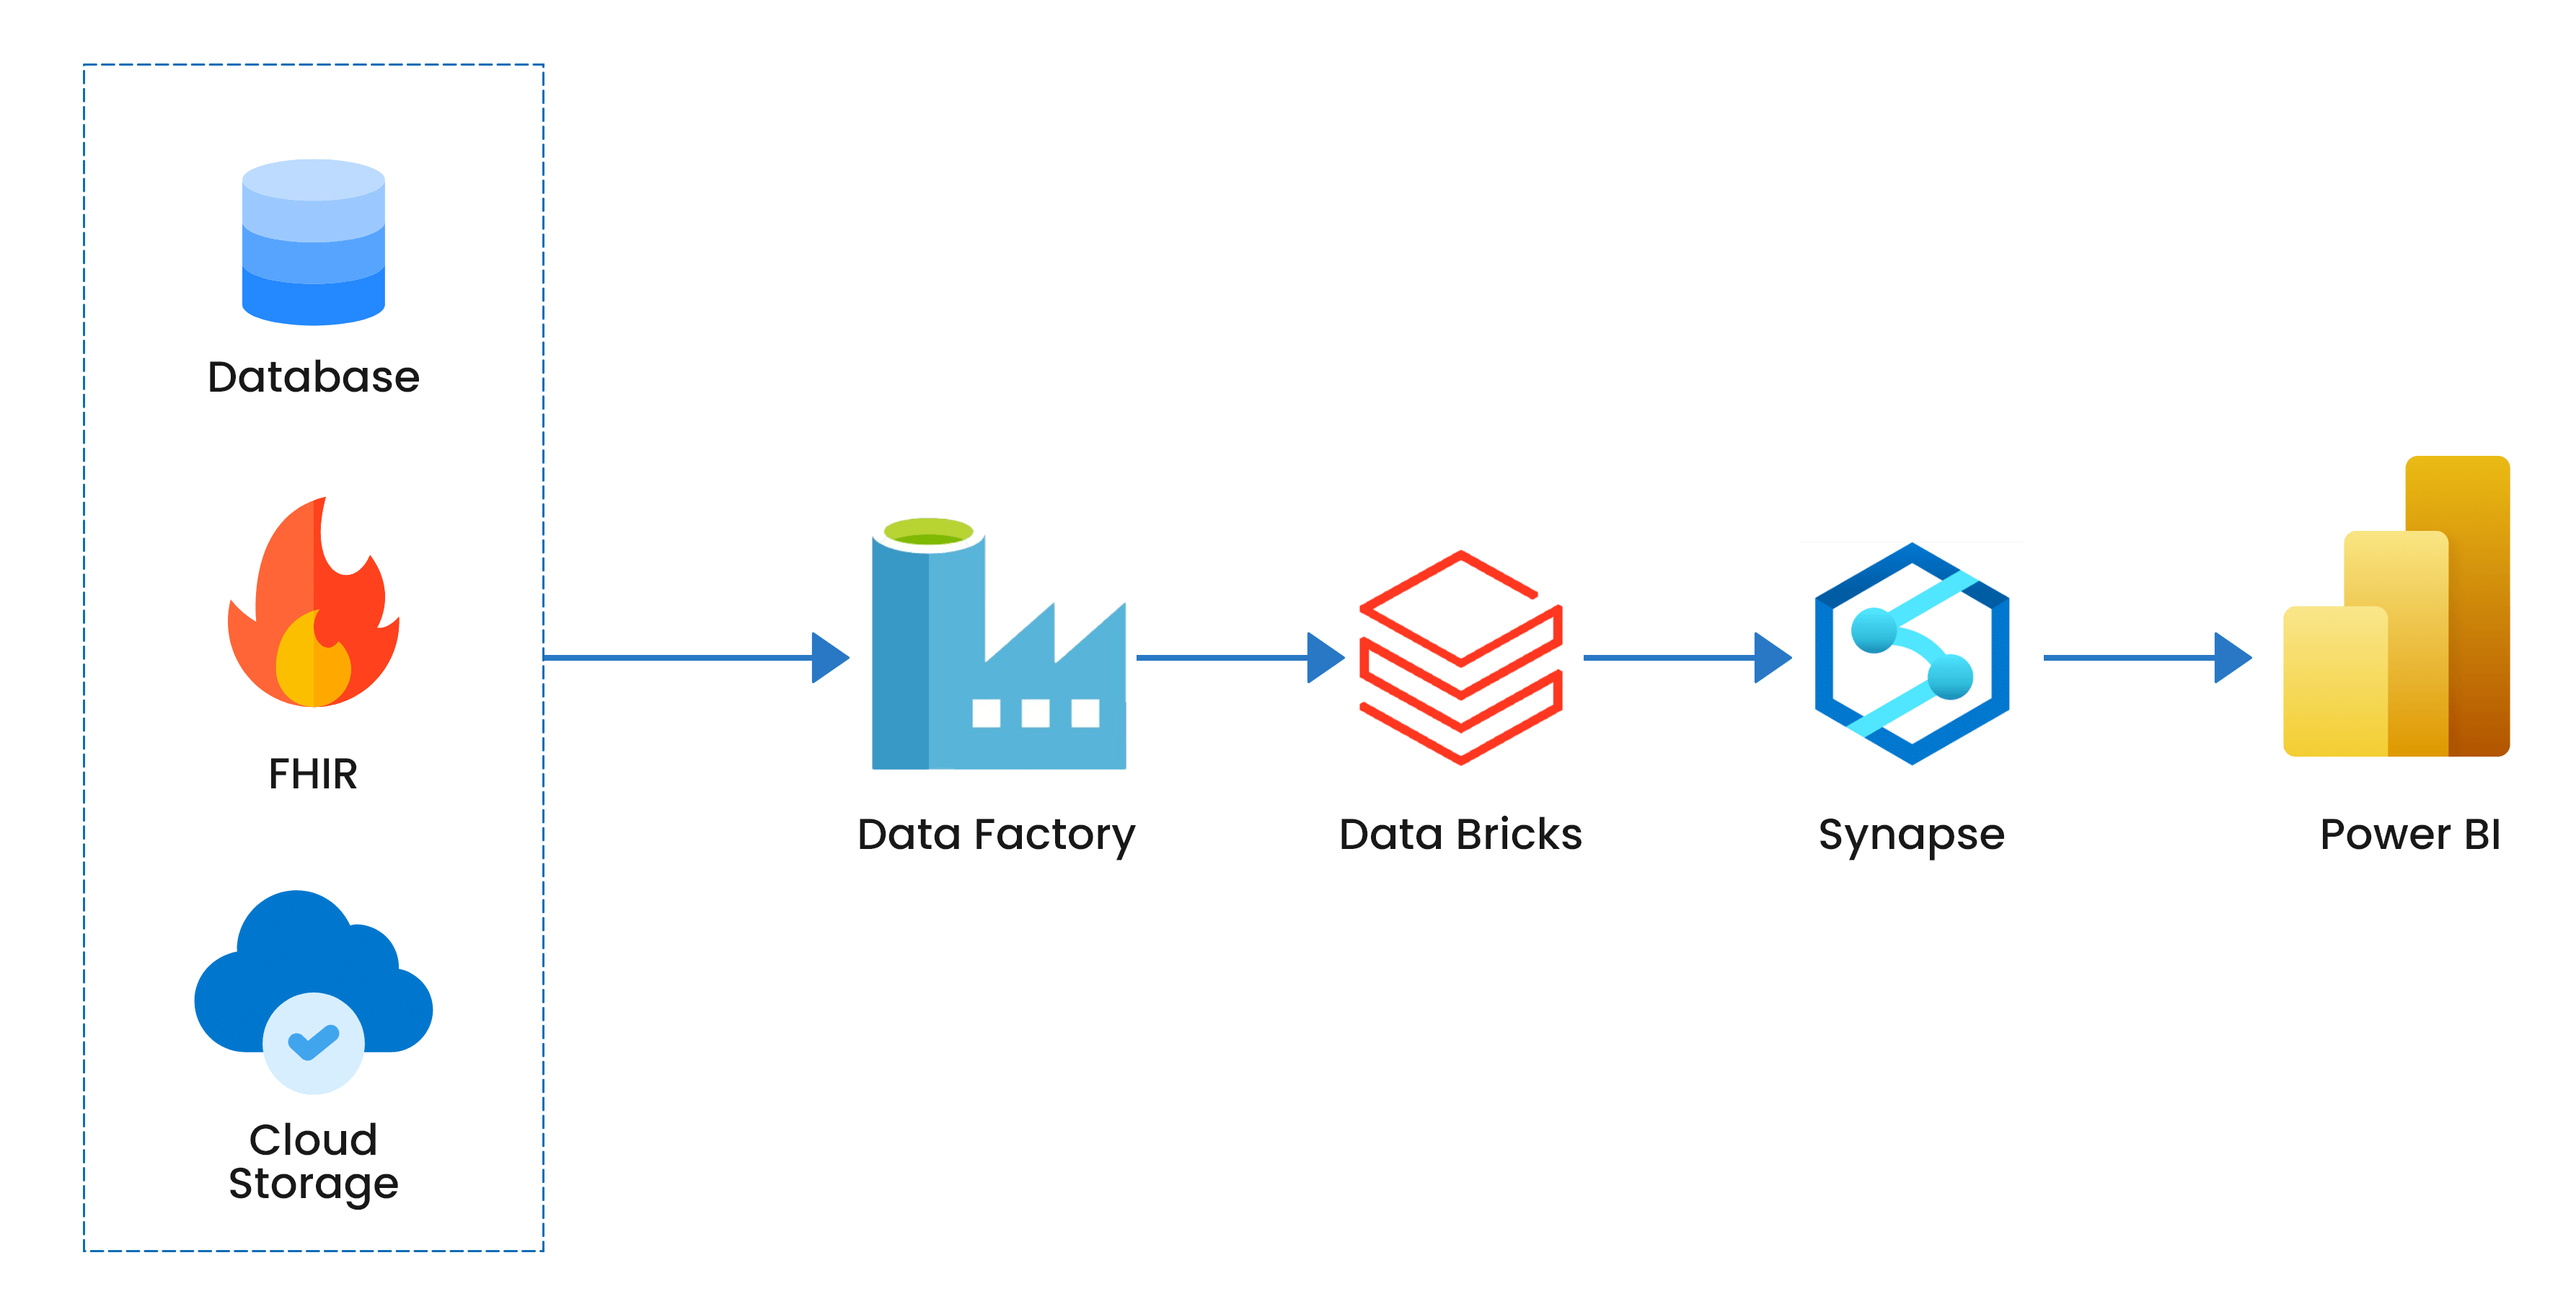
Thinkitive Technologies assembled a group of domain specialists and data engineers to devise a strategy for constructing a data warehouse and choosing a reporting tool, given that client data was dispersed across numerous locations, such as MySQL, FHIR, and Cloud storage, among others.
The data was spread across various cloud service providers, so a warehouse was established to store all data in a single location. This determination was also made to guarantee that the current system's performance would not be impacted. Several ETL processes were composed and accumulated data in an Azure Synapse Database.
Solution Highlights
-
The ETL pipeline for data obtained from diverse sources was constructed using Azure's Datafactory and DataBricks, ensuring a robust system.
-
Extensive cloud utilization resulted in zero reporting downtime.
-
Numerous reports were generated with various pages to display segmented data according to business requirements, using PowerBI.
-
Daily data retrieval kept the information up-to-date.
-
Reports provided multiple filter options for slicing and dicing data per the stakeholders' and business requirements, such as Physicians, Nurses, Type of program, and Gender of the patient.
-
To properly represent data and convey the accurate story to users, the reports comprised tables, pie charts, line charts, bar charts, heat maps, and more.
-
A drill-down option was available to view the detailed transaction data from the summary tables.
-
Colors, font, and font colors aligned with the client platform theme.
-
Row coloring was utilized based on the business logic to demonstrate criticality.
Value Delivered
-
Enabled clients customer to monitor the status of their clinics.
-
Customers can make informed decisions on the points where they need to focus more.
-
Customers can see the revenue and their savings in one place.
-
Eased the process of admin to create reports and share them with the customers manually.
-
Physicians and Nurses can see which patients didn't send the data in the RPM programs and monitor the patient's progress.
-
Since it was a virtual patient platform, customers could monitor the effectiveness of staff in responding to the queries
Tools & Technologies
-
Azure Data Factory, Azure Data Bricks, Azure Synapse Analytics, PowerBI