Prerequisites for learning machine learning
Machine learning is based on
Statistics
Statistics contain tools that can be used to get some outcome from the data. There are descriptive statistics, which are used to transform raw data into some important information. Inferential statistics can also be used to get important information from a sample of data instead of using a complete dataset.
Linear Algebra
Linear algebra deals with vectors, matrices and linear transformations. It is very important in machine learning as it can transform and perform operations on the dataset.
Calculus
Having multiple features is used to build machine learning models as features are multiple multivariable calculi that play an important role in building a machine learning model.
Probability
Probability helps predict the likelihood of the occurrences. It helps us to reason the situation may or may not happen again. For Machine learning, the probability is a foundation.
Programming language
Python or R
As both languages contain multiple libraries to perform mathematical operations, they are widely used in machine learning.
Basic programming skills (Python)Data Structures: String, List, Tuple, Set, DictionaryLibraries: Numpy, Pandas, Matplotlib
You will need to know a few operations like storing data, accessing (CSV) and manipulating data provided the data structures, using them efficiently by understanding their pros and cons.
Machine Learning Mathematics
Machine learning is all about creating an algorithm that can learn from data to predict what kinds of objects are in the picture, recommendation engine, the best combination of drugs to cure a certain disease or spam filtering.
Machine learning is built on mathematical prerequisites and if you know why maths is used in machine learning, it will make it fun. You need to know the maths behind the functions you will be using, which model is suitable for the data and why.
Let’s start with an interesting problem of predicting house prices, having a dataset containing a history of different features and prices. For now, we will consider the area of the living space in square feet and the costs. Now we have a data set containing two columns, as shown below.
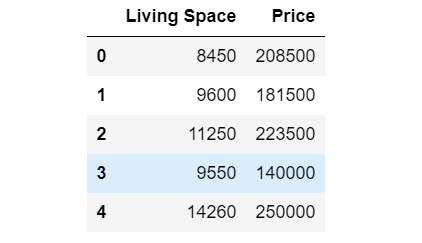
There must be some correlation between these two variables to find out. We will need to build a model that can predict house prices. How can we do it?
Let’s graph this data and see how it looks like:
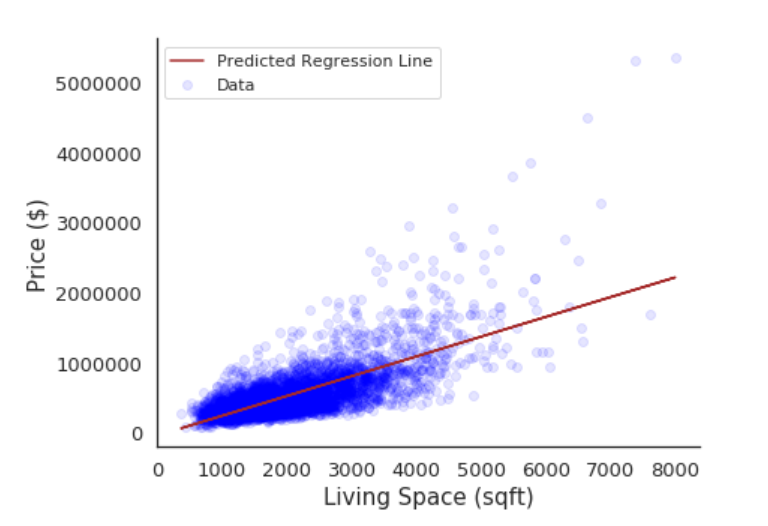
Here X-axis is the price per sqft of living space and the Y-axis is the house’s price. If we plot all the data points, we will get a scatter plot, which can be represented by a line as shown in the figure above and if we input some data, it will then predict some outcome. Ideally, we have to find a line that will intersect the maximum data points.
Here we are trying to create a line which is termed as
Y=mX + c
This is called linear regression. This allows to study and summarize a relation between two variables.
X = Independent variable
Y = Dependent variable
c = y-intercept
m = Slop of line
If we consider the equation, we have values for X, which is an independent variable but, if we have values for m and c, We can easily predict the value of Y.
How do we find these variables?
To find these variables, we can try many values and try to find a line that intersects the maximum number of data points. But how can we find the best fit line?
To find the best-fit line, we can use the least-squares error function, so if we try to check a bunch of numbers using this line, we can now find an error between the real value of y and the predicted value y`.
We have to find the best fit line. We can use a mathematical function least-squares error to see this line, which can be given below.
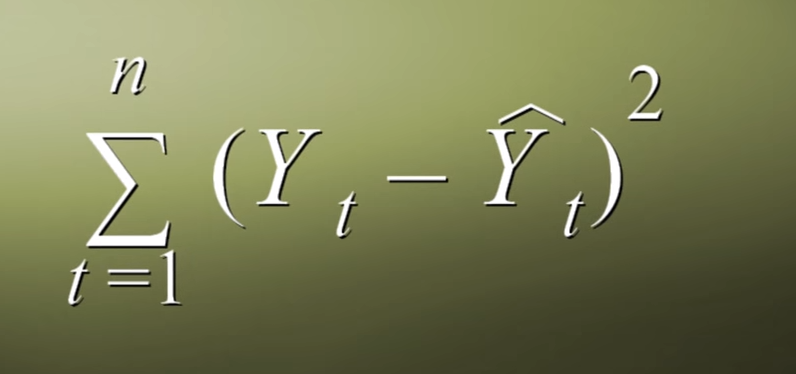
Using this function, we can find the error in each real data point and predicted data point, sum all the errors and square them to see our error.
If we add the third axis to our graph containing all possible error values and plot in 3-dimension, it will look below.
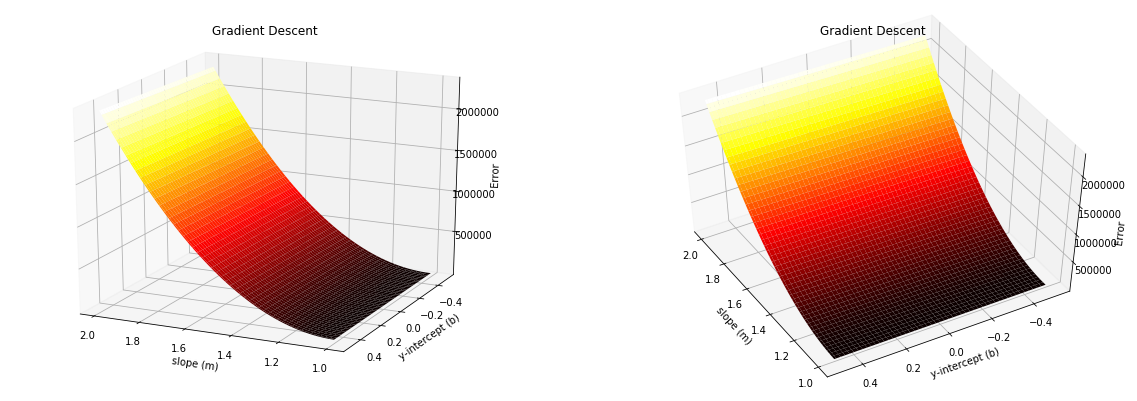
Here ideal values would be in the bottom black part, which will predict price close to real data point but, how do we find the best possible deals form and c? Here the optimization technique from calculus called gradient descent is used to find the best possible value.
Gradient Descent
This will allow us to find the minimum value iteratively, which uses the error for the given data point to compute our unknown variable’s gradient. We can use a gradient to update our two variables, then we will move on to the next data point and repeat the process repeatedly to find a minimum value where the error is minimum.
Linear algebra
If we think practically the apartment prices don’t really depend only on price per square foot, there are many factors such as the number of bedrooms, bathrooms, etc. If we consider those features as well, then the equation will look something like this.
Y = b0 + b1x1 + b2x2 + …..+bnxn + c
This is multilinear regression; this belongs to linear algebra, here we can use matrices of size mxn where m is features and n are data points.
Probability
Let’s consider probability and change our perspective towards a solution to our problem. Here instead of finding out the price, we will try to predict the house’s condition, so we will be able to classify a house with the probability of being in good condition or bad condition.
Considering probability, if we change our perspective towards a solution to our problem and instead of finding a price, if we try to predict the house’s condition, we will classify the house with the probability of being good or bad condition. For this to work, we will have to use a technic called logistic regression, which works on the possibility of occurrences and that can be given by the sigmoid function, which goes between 0 to 100.
Summary
This article covered the prerequisites of machine learning and how they are applied in machine learning. So basically, it consists of statistics, calculus, linear algebra and probability theory. Calculus has techniques used for optimization, linear algebra has algorithms that can work on huge data sets. With probability, we can predict the likelihood of occurrences and statistics help us infer something from the sample of data sets.


Thanks for sharing. I read many of your blog posts, cool, your blog is very good.