Derivation of a Data Science Project
Every data science project is like a derivation of formulas in mathematics. In a mathematical derivation, we start with the facts and basics and apply them to move on from there; similarly, in a data science project, we start from the collected data and ask very basic questions.
Every data science project has more or less 3 stages.
- Data Gathering (a.k.a Data Wrangling)
- Data Mining (a.k.a Exploratory Data Analysis – EDA)
- Data Visualization (a.k.a GraphViz, DataViz)
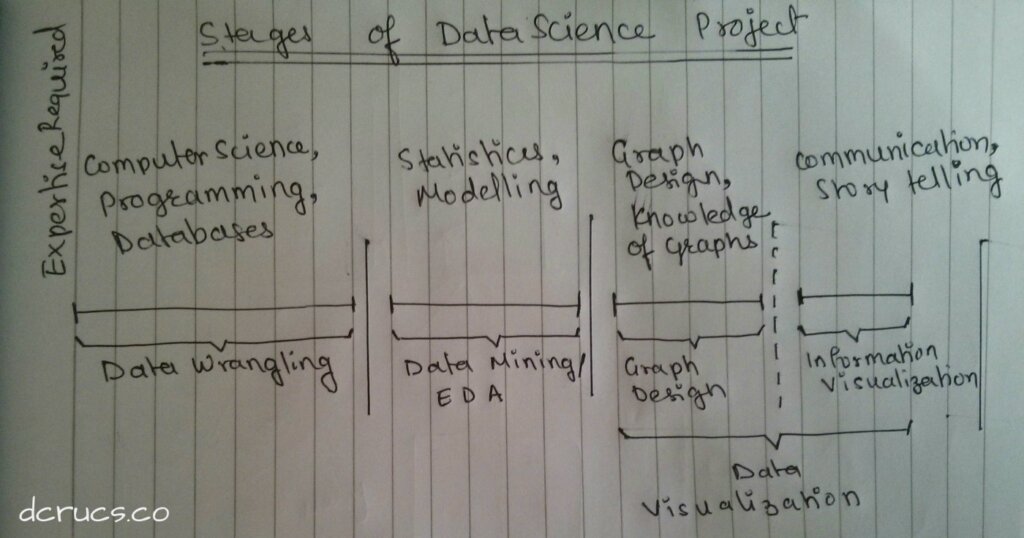
Each of the above can have multiple sub-phases, which can be iterative. Each stage has to deal with a specific domain such as
Data Gathering – Involves a lot of Computer Science.
Data Mining – Involves Statistics and Mathematics
Data Visualization – Involves Graph Design and Information Visualization
For each of these phases, we will go into detail. Let’s start with
Data Gathering
We can subdivide the data gathering phase into sub-phases.
- Data Collection
- Data Storage
- Data Preprocessing
Data Collection:
It is a stage where the data is gathered. Data can come from many different sources, e.g., Logs, User data, Application data, Application logs, …etc. The web is a major source of free data. The data on the web can be crawled via. Crawling programs such as scrappy, selenium, beautiful soup,…etc. To know more about crawling web pages with scrappy, check out the tutorial here.
Data Storage:
The data collected in the previous stage needs to be stored efficiently to be further processed. This phase involves the storage of collected data inefficient stores such as databases, data lakes. A few examples can be Files, HDFS, MySQL, MongoDB, Elasticsearch. Each of these storage mechanisms has some special qualities to suit the needs. Choose appropriately.
Data Preprocessing:
Till now, we have successfully collected and stored data. The data as-is is not very used full to perform analysis on. It needs to be processed so that it can be processed and insights can be drawn out of it. A major chunk of data preprocessing involves data cleaning. In data cleaning, the inconsistent data is removed and only the consistent data is retained. Also, if the data contains non-uniform fields, those are converted to uniform fields. For example, the data has a field that contains ‘Date,’ but the date field contains values in different formats such as MM/DD/YY, DD/MM/YY, etc. It has to be converted to a uniform format.
Data Mining (EDA)
This phase is also called (Exploratory Data Analysis-EDA). Intentionally we will leave out the Statical Modeling(Machine Learning-ML) here. It will be covered in a different blog post. One can also consider ML modeling a part of this stage. Our focus will be on EDA for now.
The most important part of EDA is to find insights. Essentially it’s a communication between you, the data scientist and the data. It doesn’t have to be sophisticated or simple, for that matter. It can be complex and it’s okay as long as you can find insights from it. One primary form of performing EDA is to draw visualizations. See if those are in line with the hypothesis and assumptions made when starting the project.
Information Visualization (communication/story telling)
This is the last and most important phase of the data science project. It involves data visualization that will communicate insights into the target audience. The visualization has to be clear and correct with appropriate communication(text) wherever required. Remember, this is projected to an open-ended audience who might misinterpret the visualizations as one is unaware of the audience’s background.
There are some tips to consider while creating visualizations, visual encodings, visual layout ..etc. A few things to consider while creating visualizations are different biases such as author, data, reader, etc.
One last step is to verify that hypothesis with the graphs. If they clearly confirm or deny the hypothesis, One can say that the project is conclusive. If not, repeat the process 😉
For any questions and inquiries, visit us at thinkitive


